2 Data
Our project will temporarily involve three data sources for the time being.
The first dataset is a csv file obtained by Qisen Wang from the website U.S. Drought Monitor, which contains specific drought severity levels for California from 2013 to 2023. This file contains multiple dimensions, and in addition to time and region, the dataset uses six intervals (None, D0-D4) to categorize drought levels. We plan to read the csv file directly in RStudio. Data source: https://droughtmonitor.unl.edu/DmData/DataDownload/ComprehensiveStatistics.aspx
The second dataset is a csv file obtained by Qisen Wang at the website U.S. Drought Monitor, which contains the number of weeks (consecutive weeks or total weeks) that each region of California has been in some degree of drought from 2013-2023. This file contains multiple dimensions; in addition to time and region, the dataset records the start and end dates of each drought period with StartDate and EndDate, and the number of weeks the drought lasted with ConsecutiveWeeks. We plan to read the csv file directly in RStudio. Data source: https://droughtmonitor.unl.edu/DmData/DataDownload/WeeksInDrought.aspx
The third dataset is a csv file obtained by Qisen Wang at the website National Centers for Environmental Information, which contains data on natural hazards, including droughts, experienced by California from 1980-2023. This file contains several dimensions, in addition to the name, time, and type of natural disaster, the dataset records the economic damage caused by the disaster in Total CPI-Adjusted Cost and the number of deaths in Deaths. We plan to read the csv file directly in RStudio. Data source: https://www.ncei.noaa.gov/access/billions/mapping
2.1 Description
First of all we are interested in the specifics of the California drought, we want to know over what period of time the drought conditions have actually gotten severe and what the trend in the drought conditions has been, and that trend and that detail we can get from the first dataset. Secondly we are also interested in the drought conditions in individual counties within California, we would like to know which counties have the most severe drought conditions and if there is any specific link between drought duration and geographic location, and this information can be obtained from the second dataset. After analyzing the specifics of the drought, we wanted to learn more about the impacts caused by the drought. We plan to extract drought-related data from the overall natural disaster data and analyze the economic losses and tens of thousands of people caused by the drought, which is something the third dataset can help us with.
2.2 Missing value analysis
To analyze missing values, we draw some heatmaps to visualize the distribution of NA in our data.
The number of ground elements in each dataset is pretty large, so we group some data items by variables of interest before drawing.
We divide variables into two categories: numeric and non-numeric varibles, and analyze them respectively.
For numeric variables, we compute the mean values or sum of these groups and then standardize across the dataset.
Other variables are treated as non-numeric, and we just check whether there are missing values of these variables in groups.
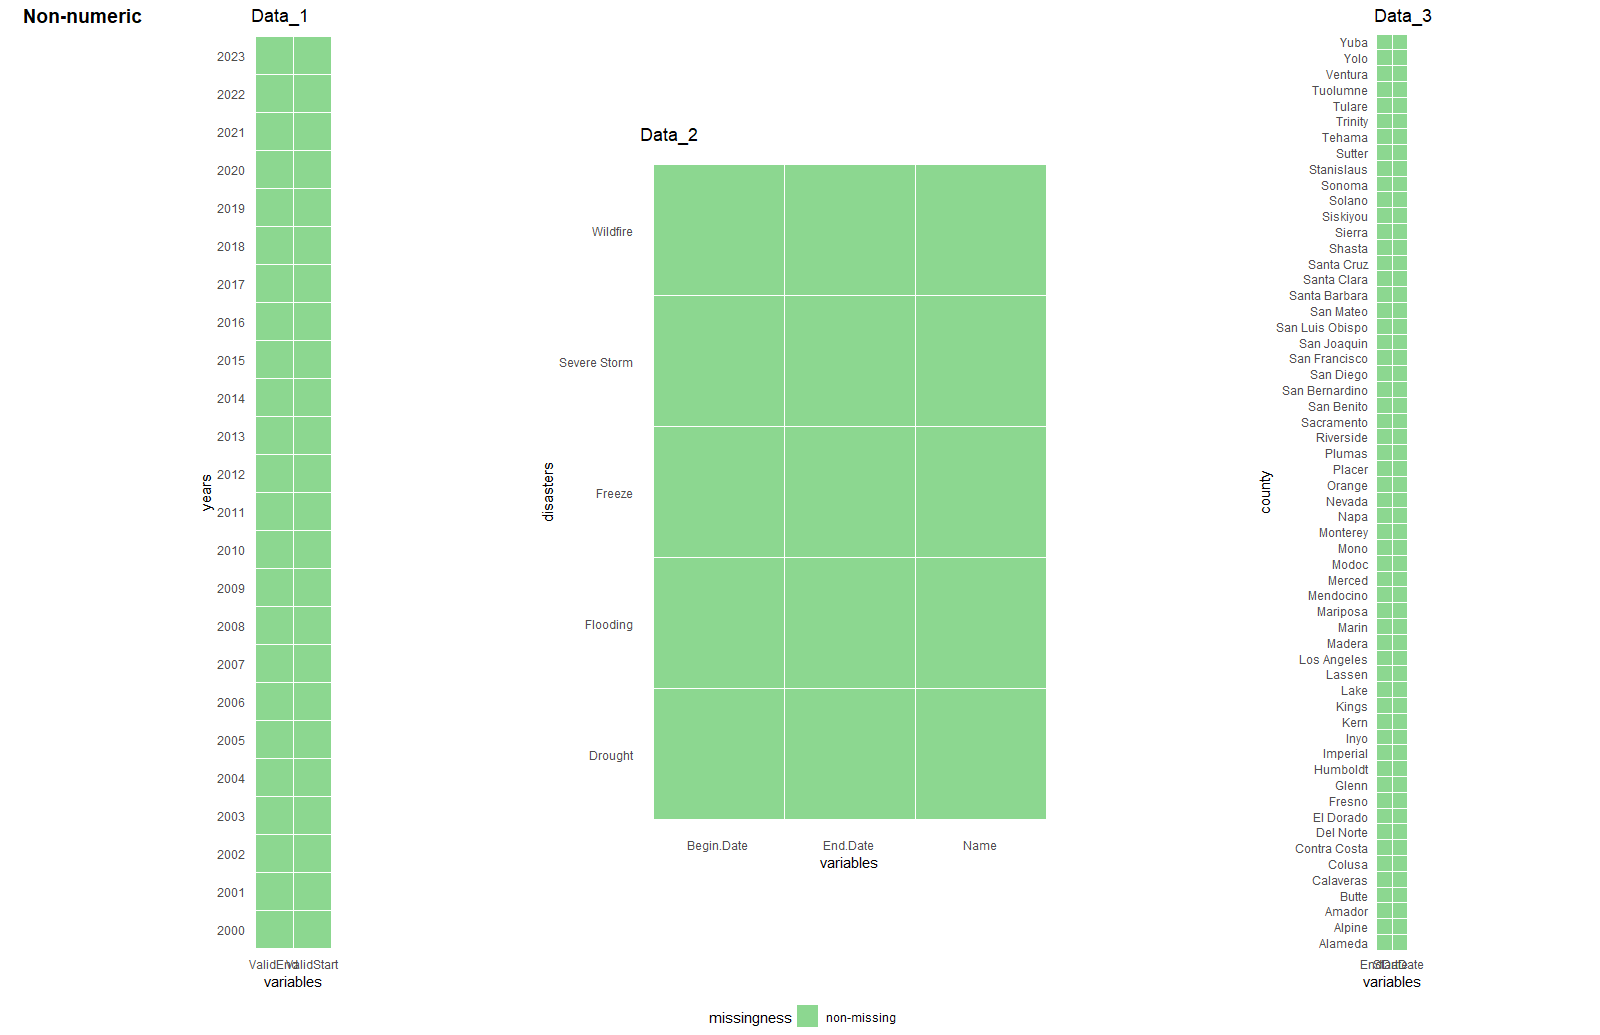
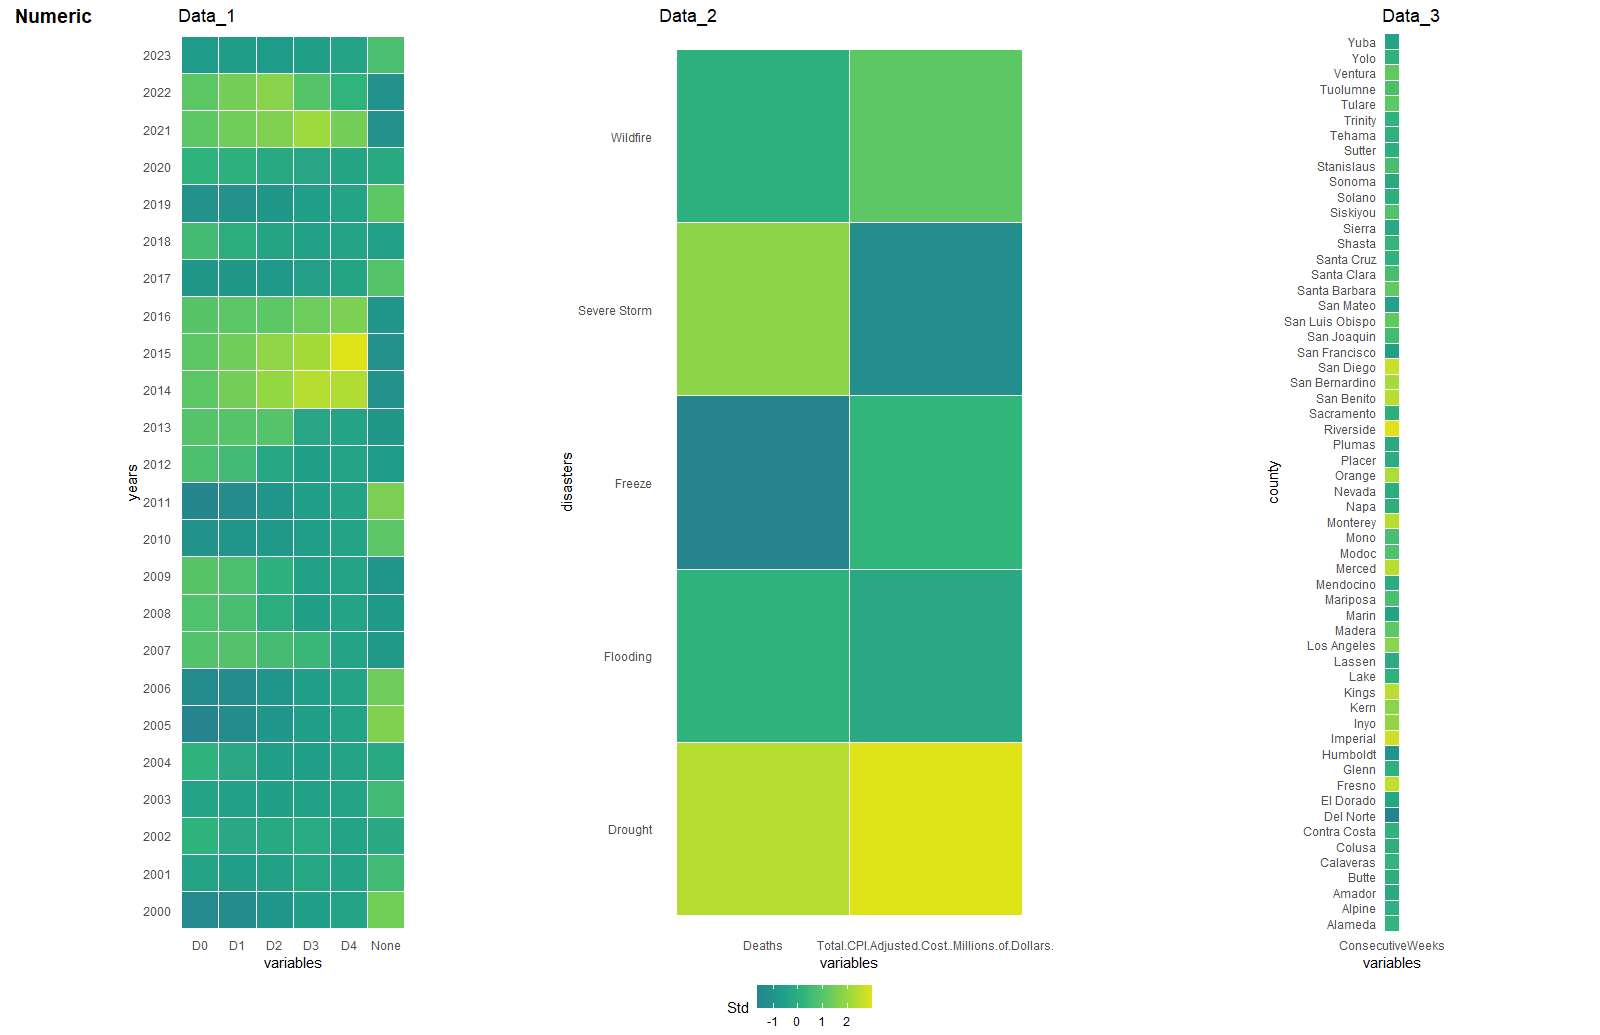
Missingness in numeric and non-numeric variables of 3 dataset is shown in two pictures above.
Apparently, no missing value has been found in our data (otherwise there will be some grey blocks in these heatmaps).
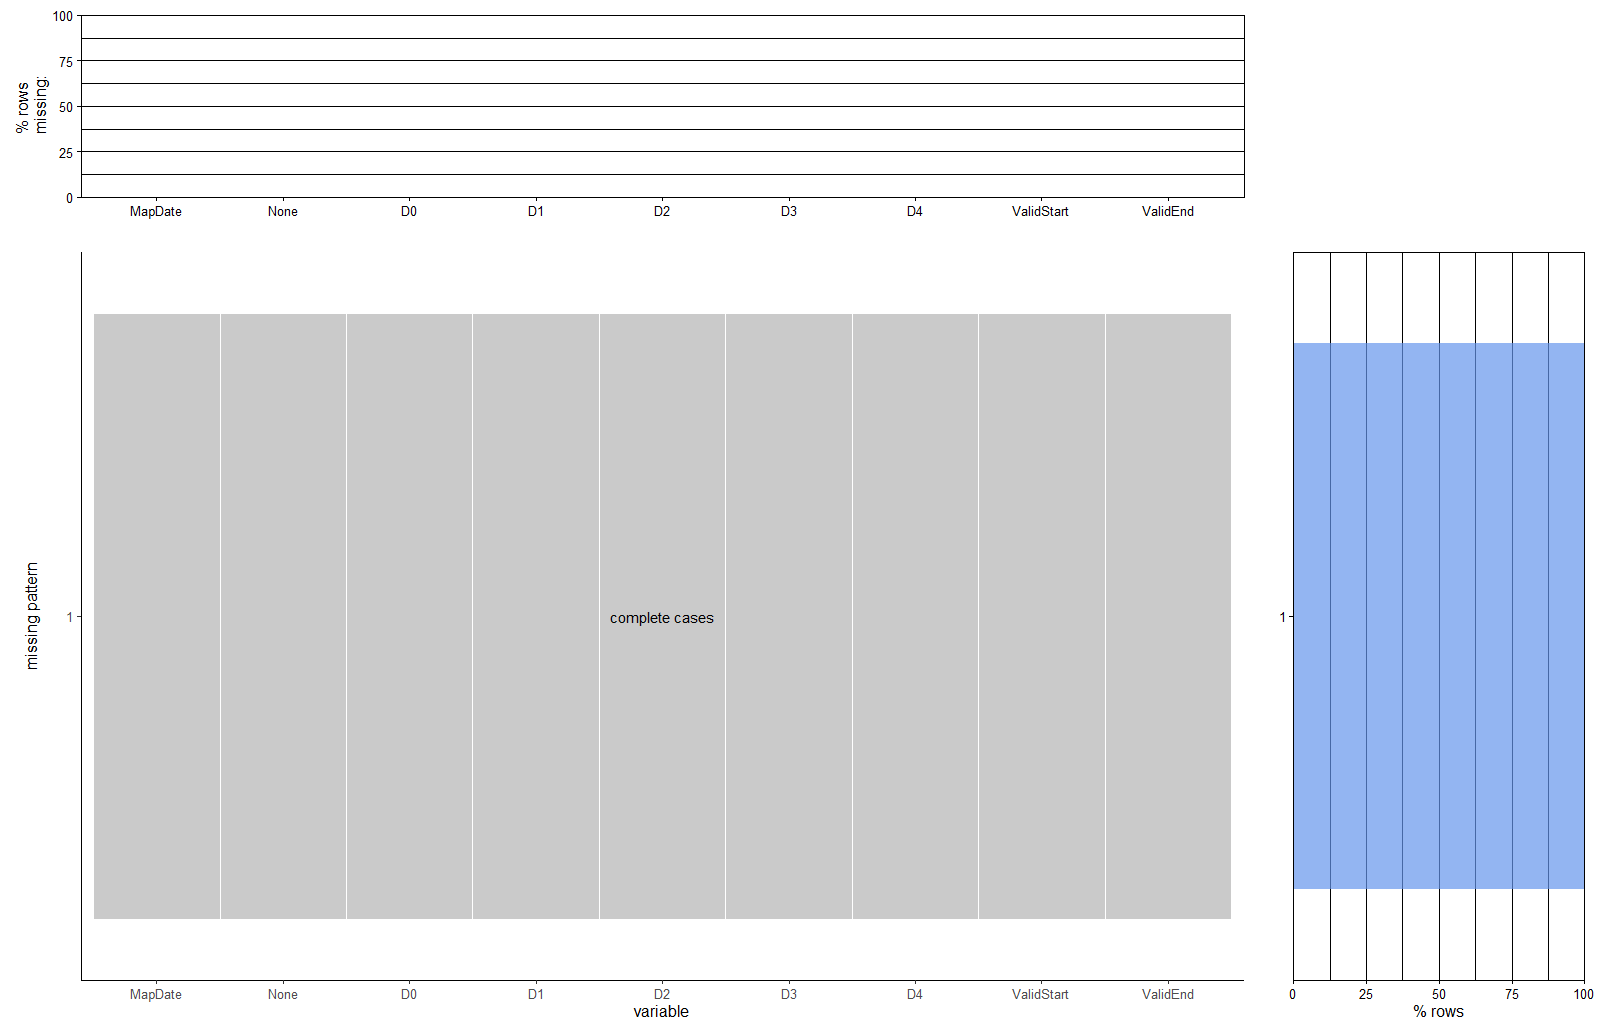
It can be also verified by using redav::plot_missing(), which shows that our data is complete. (The aggregated missing patterns in 3 dataset are same and we just show one of them)